2025 Carbon Footprint Assessment

In 2022, XLG conducted its first carbon footprint assessment.
Three years later, the exercise has become an annual tradition, and 2025 marks a new milestone: precision.
This year, we took our analysis of our figures a step further: we aligned our Carbon Footprint with the GHG Protocol, the international benchmark standard for carbon accounting. Specifically, we have adopted emission factors selected on a case-by-case basis, collected more data directly from our suppliers, broken down purchases item by item through our accounting system, and fully accounted for all commuting between home and work.
The result: a more comprehensive, more accurate, and audit-ready assessment—a solid foundation for the next phase of our climate trajectory.
2025 Results at a Glance
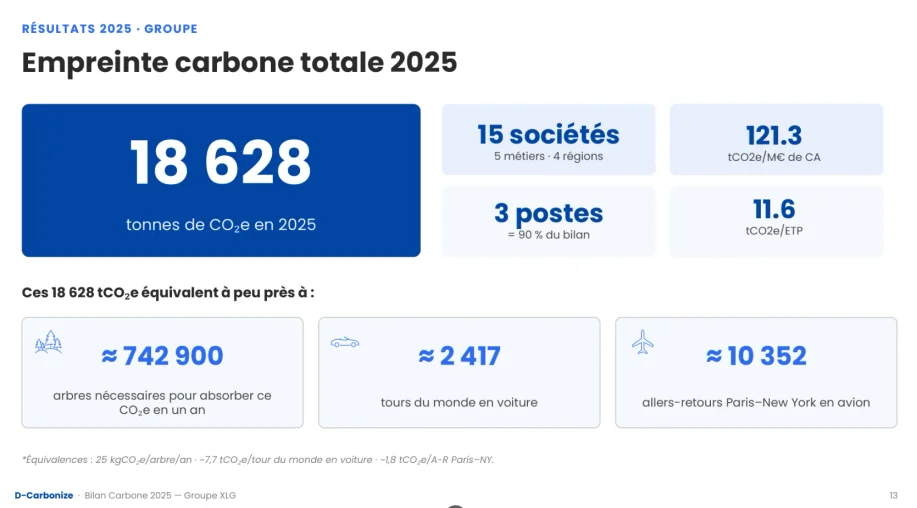
Our 2025 carbon footprint totals 18,628 metric tons of CO2e, covering 15 companies, 5 business lines, and 4 regions. Two new business lines—Damage Control and Roofing—have been added to the scope this year.
Three areas alone account for 90% of our environmental footprint: procurement (46%), transportation (24%), and fixed assets (20%).
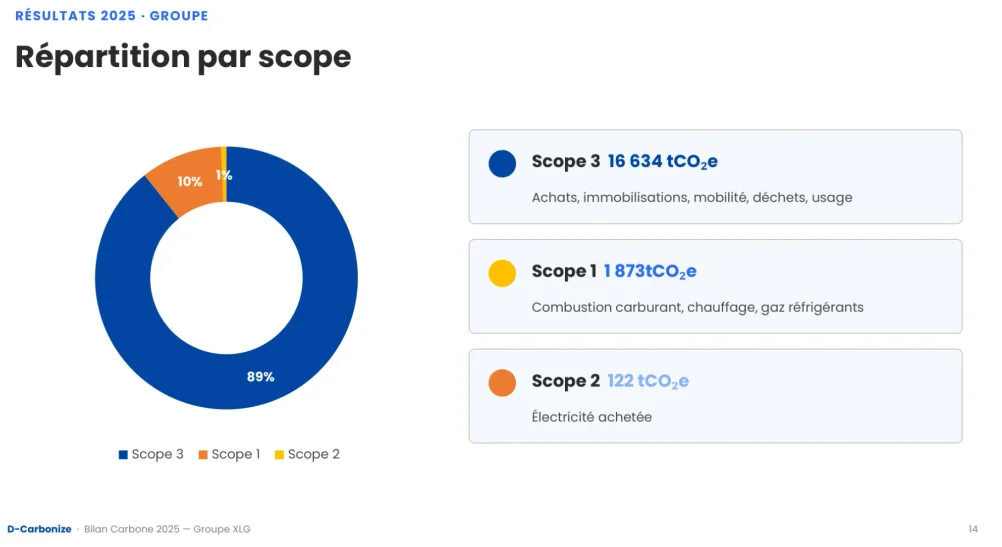
As is to be expected for a service company, Scope 3 emissions (indirect emissions related to our value chain—purchases, transportation, fixed assets, waste, and usage) account for 89% of the total.
Scopes 1 and 2, which cover our direct emissions and purchased electricity, remain marginal at 11 percent.
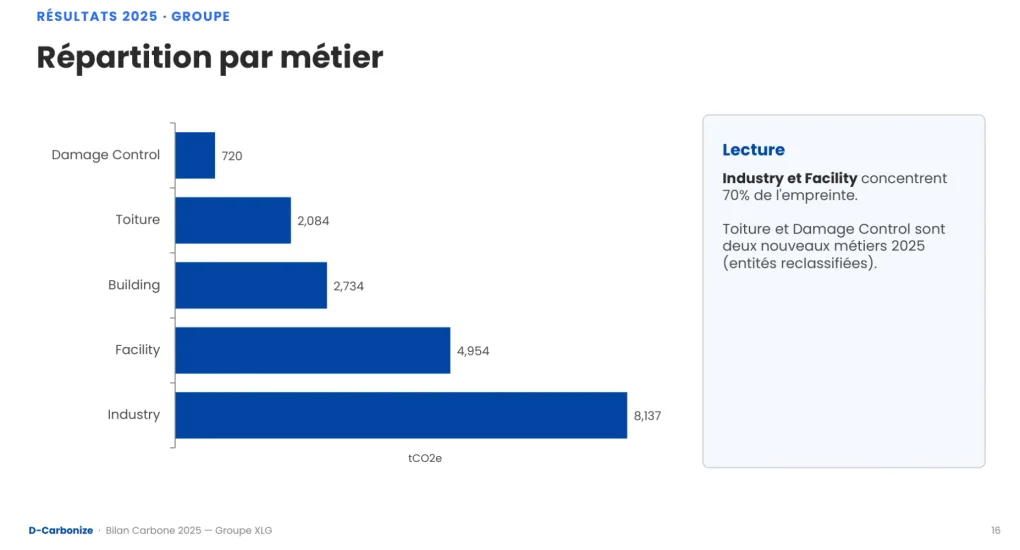
In terms of business lines, Industry and Facility account for 70% of the Group’s operational footprint; they are also our operations that require the most equipment and field mobility.
See the impact, right down to the field
Another new feature for 2025: in addition to the Group-wide view, we’ve presented these results broken down by region. The goal is for each local team to see exactly how much weight their own operations carry. It’s this level of detail that makes the data actionable: we understand much better what we can reduce when we see the impact of our own fleet of vans or our own warehouse.
Why the numbers have changed so much
If you compare these 18,628 metric tons to the 2024 results, the difference is striking. But keep in mind that this increase reflects virtually no actual growth in activity. It mainly reflects a measurement system that has become much more precise.

On a like-for-like basis, three methodological changes account for 91% of the variance:
- Purchases: We now capture 100% of expenditures (compared to a partial estimate in 2024), using customized emission factors rather than default values.
- Fixed assets: The GHG Protocol requires that an asset be recognized in full in the year of its acquisition, whereas the 2024 method spread its impact over its depreciation period. A warehouse purchased in 2025 therefore appears immediately on the balance sheet, rather than gradually over 20 years.
- Commuting: It is now calculated based on the entire route (home → headquarters → job site) rather than just the work-related portion.
And now: Let's set our sights on the SBTi
This 2025 Carbon Footprint Assessment is not an end in itself. It is the foundation upon which we will build a credible and verifiable reduction pathway.
We have made a bold decision: XLG will join the Science Based Targets initiative (SBTi) by the end of 2027 at the latest. In practical terms, this means setting emission reduction targets aligned with the IPCC’s scientific recommendations for limiting global warming and having them validated by an independent body.
At the same time, we have already identified our priority areas for further refining the metric in 2026: improving the reliability of supplier data, leveraging the guarantees of origin for our electricity, centralizing the tracking of fuel cards, and automating data collection using AI—whose own carbon footprint we also plan to measure, for the sake of consistency.
A more rigorous carbon assessment and a clear path toward the SBTi: 2025 was the year we laid a solid foundation for our climate trajectory. We’ll tell you what happens next in 2026!